
VERITAS MAPS
See how different life can be across America.
Interactive maps and dashboards that turn vast public datasets into something anyone can explore, no data team required. Every view shows its sources, and the source data is left unchanged.
- 3,300+county measures
- 60+public data sources
- 400+ZIP-code measures
- 200+countries
How it works
Pick a measure
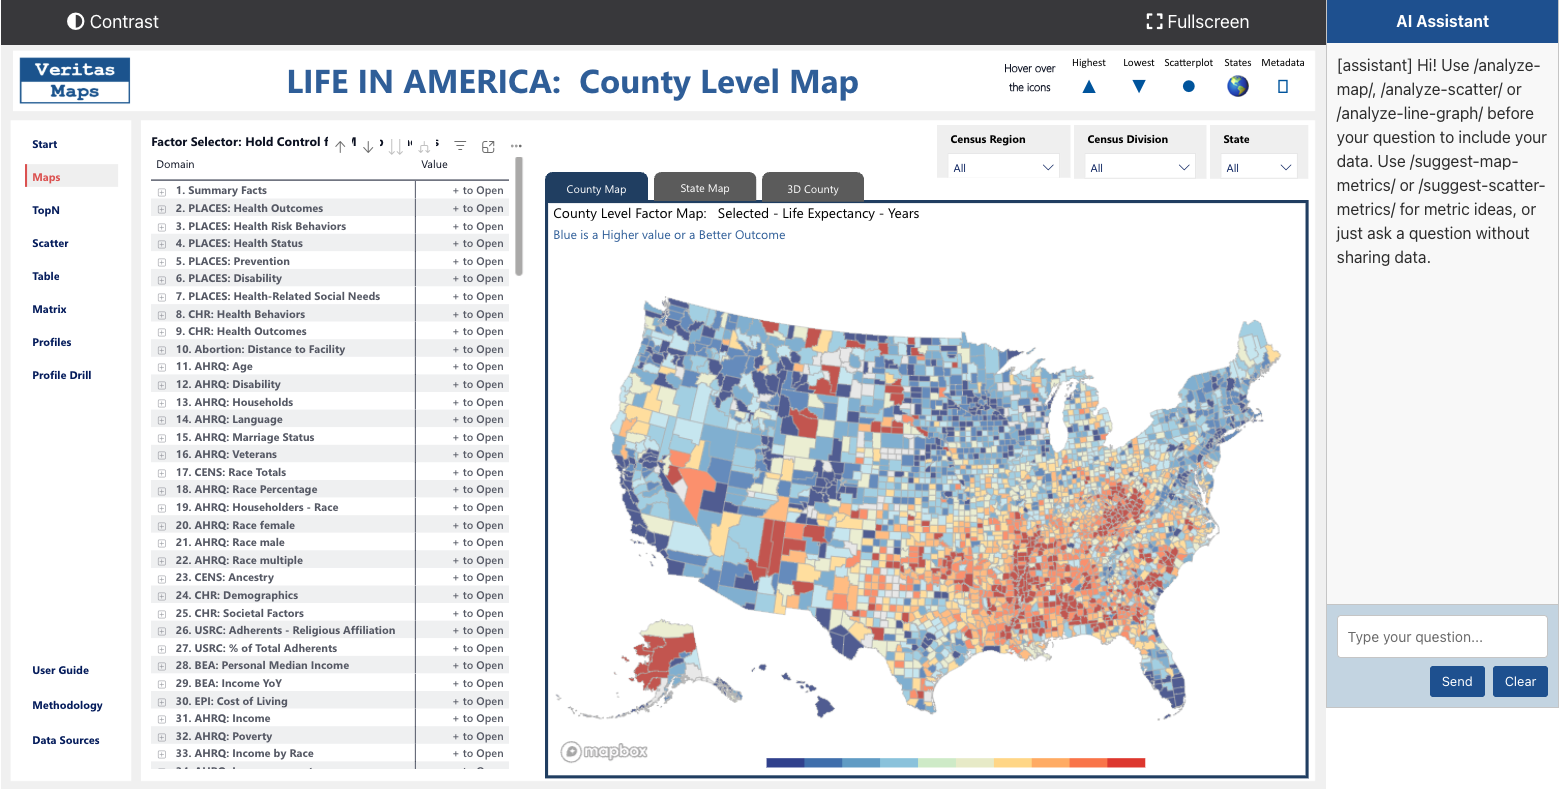
Choose from more than 3,300 measures and the map repaints instantly.
Combine measures
Add others that run the same direction, such as better to worse, for an on-demand ranking.
See the story
Read the pattern on the map, then check it in rankings, tables, and profiles, or ask the built-in AI assistant.
Six ways to look at the data
- Maps
- Rankings
- Scatter plots
- Tables
- Matrix
- Profiles
What you can explore
- County
County Atlas
3,300+measures
Population, health, mortality, weather and disasters, inequality, crop production, and social attitudes.
- 60+ sources
- Census
- CDC PLACES
- AHRQ
- BEA
- ZIP code
Social Determinants of Health
400+measures
How social, economic, and environmental conditions shape health outcomes.
- CDC PLACES
- AHRQ
- County and census tract
Health & Climate
900+measures
Weather risk, social vulnerability, and the health impacts of extreme weather.
- FEMA
- CDC PLACES
- AHRQ
- Country
Life in the World
200+countries
The 17 UN Sustainable Development Goals (230+ indicators) and 550+ World Development Indicators.
- UN
- World Bank
- WHO
Source data left unchanged
Beyond standard cleaning and basic calculations, nothing is altered.
Every view documented
Each report lists its data sources, a glossary of measures, and its methodology.
You draw the conclusions
Information is presented without bias, so the data tells the story.
Who it's for
Veritas Maps is a sister company to Oahe Data, and its visualization methods underpin Oahe's own dashboards.